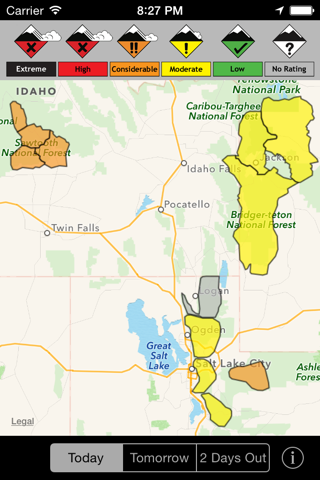
The easiest way to see current avalanche danger levels at-a-glance, for every forecast center in North America!
Bottom-line danger levels are shown color-coded for each forecast region on a map, based on the selected timeframe (Today/Tomorrow/2 Days Out). Click on any region to view the detailed avalanche forecast from the source forecasting center.
All content youve viewed is cached for offline use, so you can refer back to the information youve seen even if you lose coverage in the mountains.
We support 100+ forecast regions, sourced from the NWAC (Northwest US), CAIC (Colorado), UAC (Utah), SAC (Central Sierras), ESAC (Eastern Sierras), MSAC (Mount Shasta), BTAC (Jackson Hole), GNFAC (Bozeman), WCMAC (Missoula), FAC (Kalispell), SNFAC (Sun Valley), IPAC (Idaho Panhandle), PAC (McCall), MWAC (Mount Washington), KPAC (Flagstaff), WAC (NE Oregon), CBAC (Crested Butte), CNFAIC (Chugach), JAC (Juneau), AAC (Anchorage), HAIC (Haines), VAC (Valdez), Cordova, HPAC (Hatcher Pass), Avalanche Canada, Parks Canada, WhistlerBlackcomb, VIAC (Vancouver Island), and Avalanche Quebec (Chic Chocs) forecasting centers. 29 separate integrations to bring you the forecasts you need.
Please contact us at [email protected] with feature suggestions, bug reports, or other feedback.


